What exactly can the Census second release tell us?
This is the second blog in a series leading up to the second release of ABS Census 2021 data on 12th October 2022. In this blog, Keenan explores just what information comes out and where to find it on our economy.id sites. (*hint* follow the links)
In a previous blog, we talked about the second release of the 2021 Census data by the ABS. We mentioned that this data is mainly to do with employment variables. Here at .id we are eagerly awaiting this data to see just how much has changed in the five years since 2016. The three big questions the second release can help answer are:
- Who has a job? Who is looking for one?
- What type of work do they do?
- Where do they work?
Who has a job? Who is looking for one?
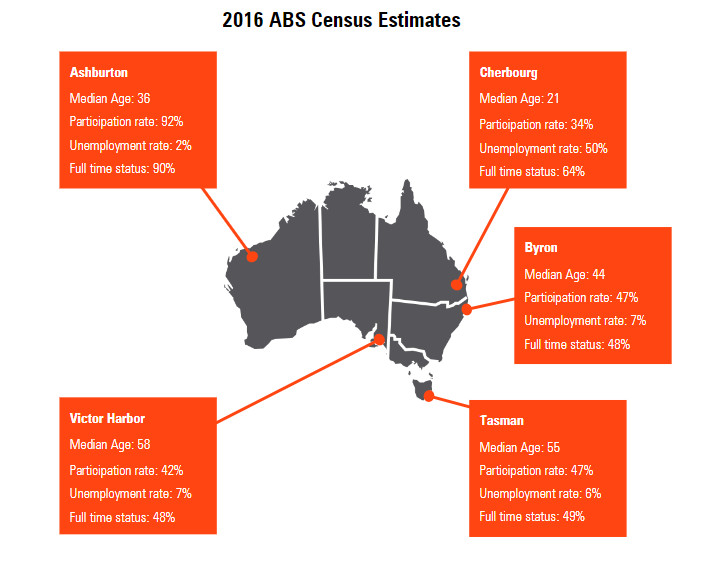
First and foremost, we get to know what share of working age people in an LGA are participating in the Labour Force (Participation Rate), whether they are employed or unemployed, and if they work full time or part time.
In 2016, one of the LGAs with the lowest unemployment rates (2%) and highest participation rates (92% of those who answered the Census) was Ashburton (WA). This is linked to the fact that it is a major resource led economy with approximately 3 jobs for every employed resident.
On the other spectrum, is the Cherbourg Aboriginal Shire in QLD which had an unemployment rate of 50% in 2016 and a participation rate of only 34%. The LGA is one of the most disadvantaged in Australia with a community that is working to address intergenerational challenges stemming from historical policies of forced resettlement and segregation.
In terms of full time work, two of the LGAs with the lowest rates were Victor Harbor (SA) at 48% and Tasman Council (Tas) at 49%. This makes sense as these LGAs had some of the oldest median ages in Australia in 2016 at 58 years for Victor Harbor and 55 years for Tasman.
The other LGA with a low rate of full time work was Byron Shire at 48%. Byron does have a high share of employment in Retail and Hospitality (industries with high part time rates). However, the image of laid back professional freelancers appears to be true too. Half of Byron residents working in Professional, Scientific and Technical Services in 2016 were working part time (51%) compared to the NSW average of only 26%.
What type of work do they do?
The second release also allows us to understand what industries and occupations people work in and what type of qualifications are needed in different roles.
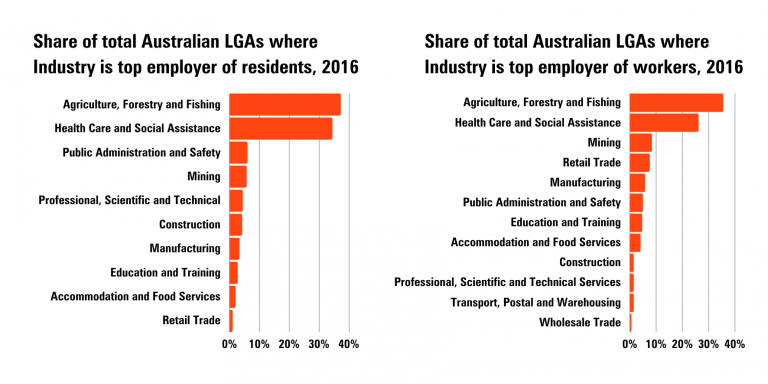
In 2016, the largest employing industry for over a third of council’s residents was Agriculture, Forestry and Fishing (37%) reflecting the sheer number of small rural councils (especially in WA). In another third of councils, the largest was Health Care and Social Assistance (35% of all LGAs). We would expect this to have grown since the last Census given the substantial increase in employment in this industry coming through in the ABS Labour Force survey data.
Different LGA’s economies have different specialisations, and this comes through when looking at the industries generating the most jobs. Retail and Manufacturing become more important reflecting the concentration of jobs in shopping centres and industrial precincts in some LGAs. The winner for the most concentrated employment by industry in 2016 was Laverton (WA). An incredible 81% of local jobs were in Mining.
In terms of occupations, Managers were the largest occupation for residents in 38% of LGAs due once again to the large amount of rural shires and the fact that ‘Farmers’ fall in this bracket. Professionals were the largest in 37% of LGAs. This is because most health and education workers require professional qualifications.
Where do they work?
A lot of councils are very interested in this topic, especially considering the last couple of COVID impacted years. The second release will help us understand where people reside versus where they work. If people filled in the census correctly their usual place of work should still be coded to the office/shop/factory they are employed at and stay at home orders would only impact their method of travel to work. However, we expect some possible data discrepancies here due to misinterpretation.
In 2016, the LGAs which had the highest share of residents working locally were Maralinga Tjarutja (SA) (100%), Palm Islands (97%) and Tiwi Islands (97%). This makes sense given the remoteness of the first and the fact the other two are Island communities. The LGAs with the lowest share of residents working locally were Prospect (SA) and Walkerville (SA) with only 12%. Both are small inner areas bordering Adelaide’s central city.
In terms of where workers come from, 97% of the workforce in Fraser Coast, Esperance and Bundaberg were local residents in 2016. On the flipside, less than 5% of Perth’s workforce resided in the city.
What about the largest job node in Australia? Well in 2016, approx. 321,000 people stated they worked in the Sydney – Haymarket – The Rocks Statistical Area (SA2). In Melbourne, 221,000 stated they worked in the Melbourne Statistical Area (SA2). Now these areas are different sizes, but when you account for park areas (The Domain, Hyde Park etc) their effective job densities were roughly the same (Sydney – Haymarket – The Rocks – 96,000 workers per km2; Melbourne – 93,300 workers per km2).
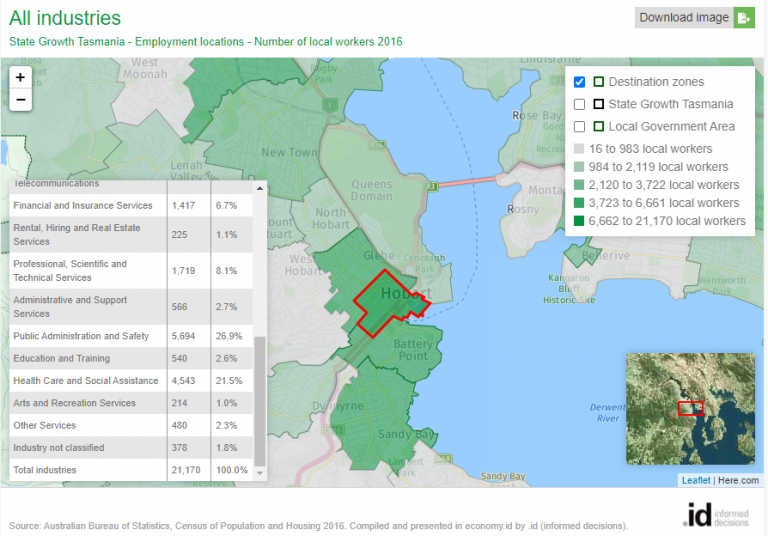
The smallest geography Census employment data is reported are called Destination Zones (DZNs) which roughly correspond to state transport zones. Our sites report employment by industry at DZN level so you can explore CBD and precinct employment structures. An interesting note is that the DZN with the most jobs in 2016 was actually Hobart.
What about remote working? Well in 2016, the two LGAs with the highest share of resident workers in knowledge intensive business services industries who were working from home were Byron (42%) and Bellingen Shire (38%).
Keep track of Census news
We will continue to blog about Census insights in the lead up to and after the second release. We will also be sending out regular communications once we start updating your economy.id sites with the local area data. To receive these communications, join our updates mailing list.
If you are from a council and want a briefing session on the new Census 2021 information or a training session using economy.id, please contact your client manager or email us at economics@id.com.au.
Keenan - Economic Development Specialist
Keenan is an economic development specialist who has worked extensively analysing and developing economic programs, strategies and policies to help local communities. Keenan works with our local government clients to help them explore and understand how their regions are changing over time to help them make better decisions and create evidence-based strategies related to local economic development.